Specialising in Water
Water - a challenging and comprehensive field of work. Managing water in Africa is a responsible task. Hydraulic engineering requires expertise and specialised knowledge.
We speak fluent water! Thanks to our many years of work in our specialised field in various African countries, we have a wealth of experience.
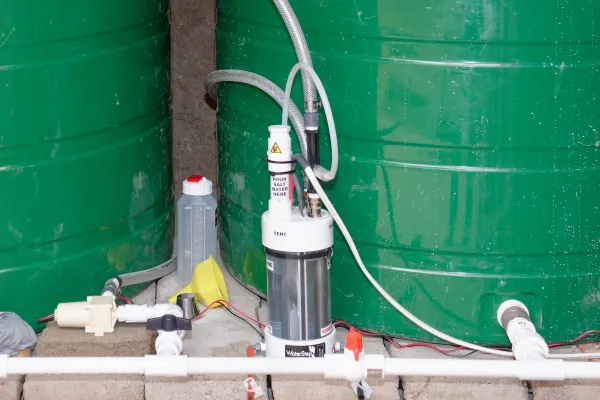
Water Supply
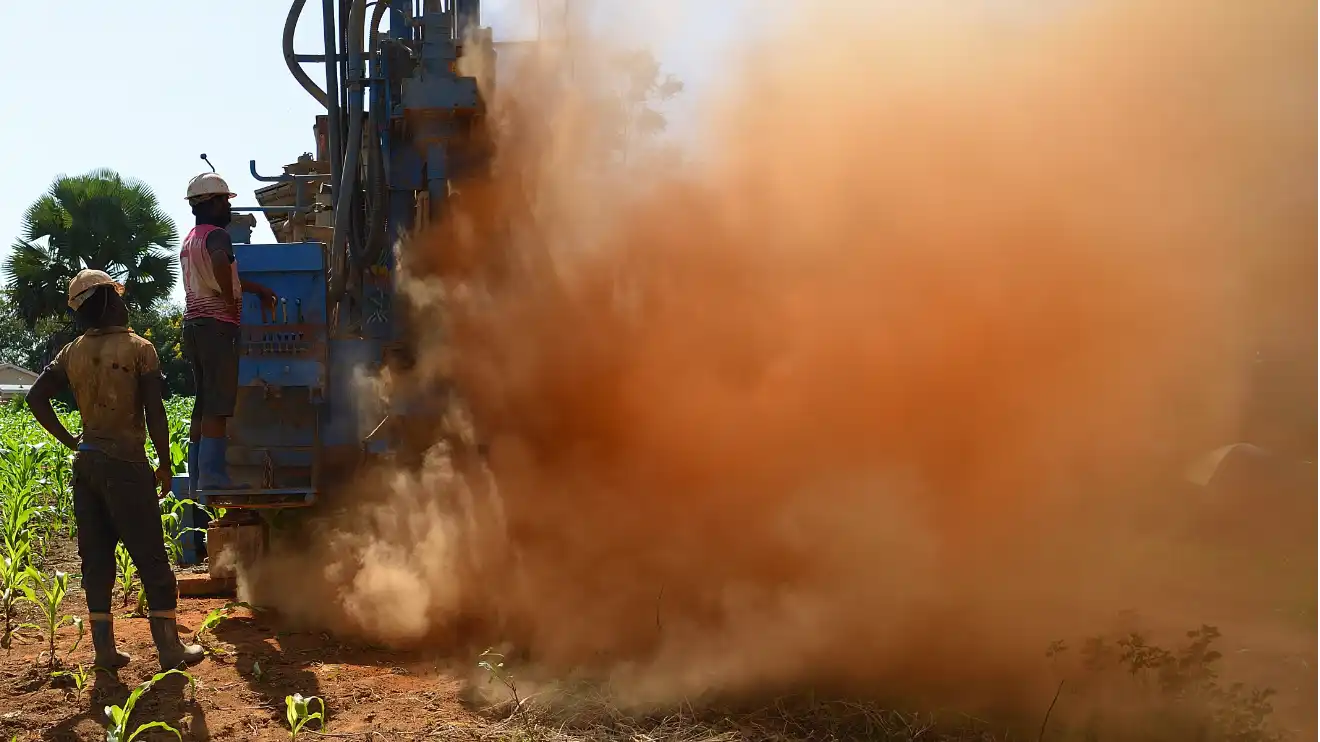
Water supply includes water extraction, water pumping, water storage and pipeline construction.
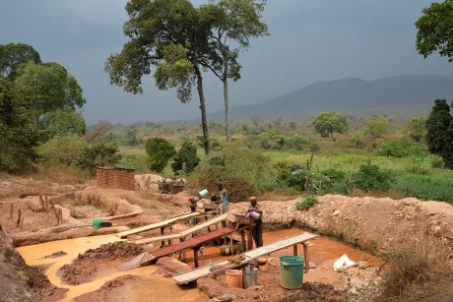
Water supply starts with water extraction. The water can come from groundwater, surface water such as rivers and lakes or from springs. Another method is the collection of rainwater.
During an on-site inspection, we decide with you what the best solution is.
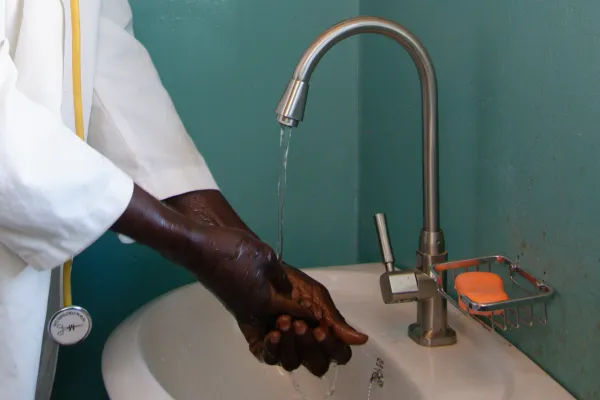
Water Treatment
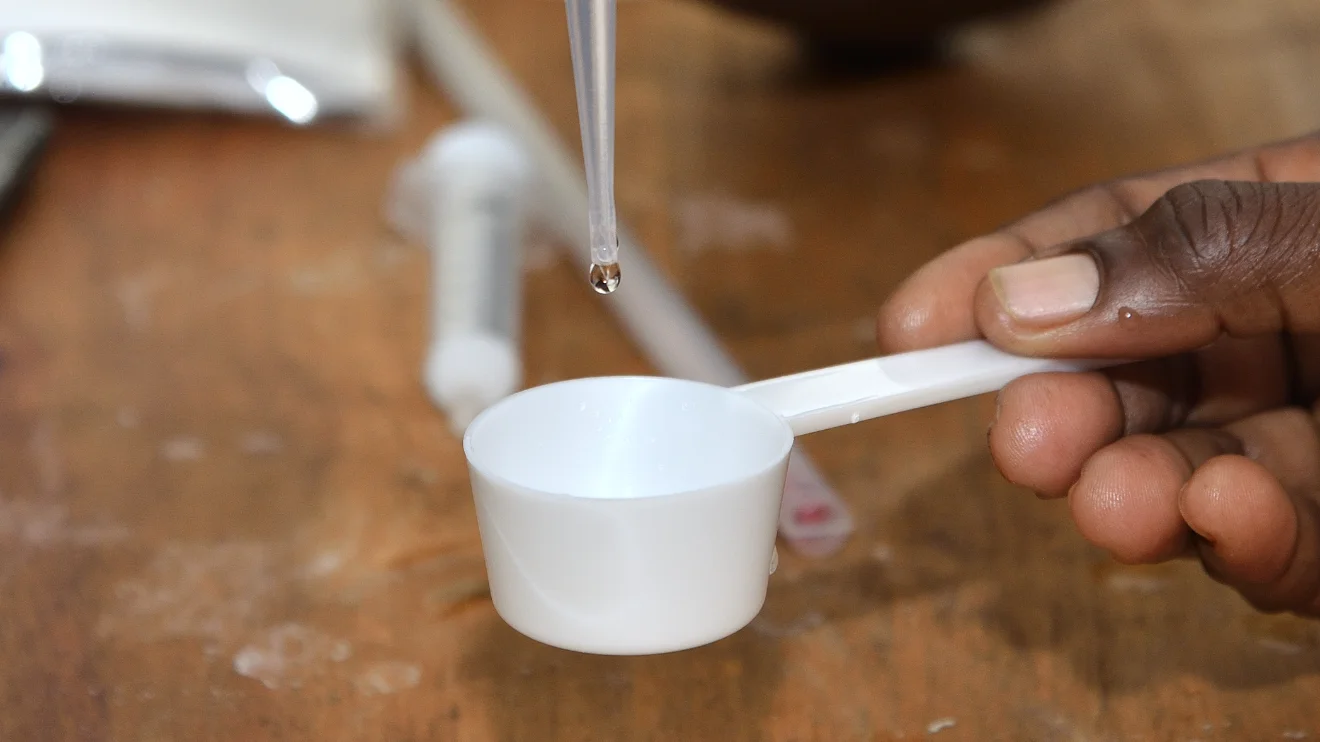
Extracted water, be it groundwater or surface water, usually has to be treated in some way so that it can be used as drinking water. Raw water often contains undesirable substances such as suspended solids, bacteria, viruses, fertiliser residues or heavy metals.
Depending on the ingredients that need to be removed, the water treatment process also changes.
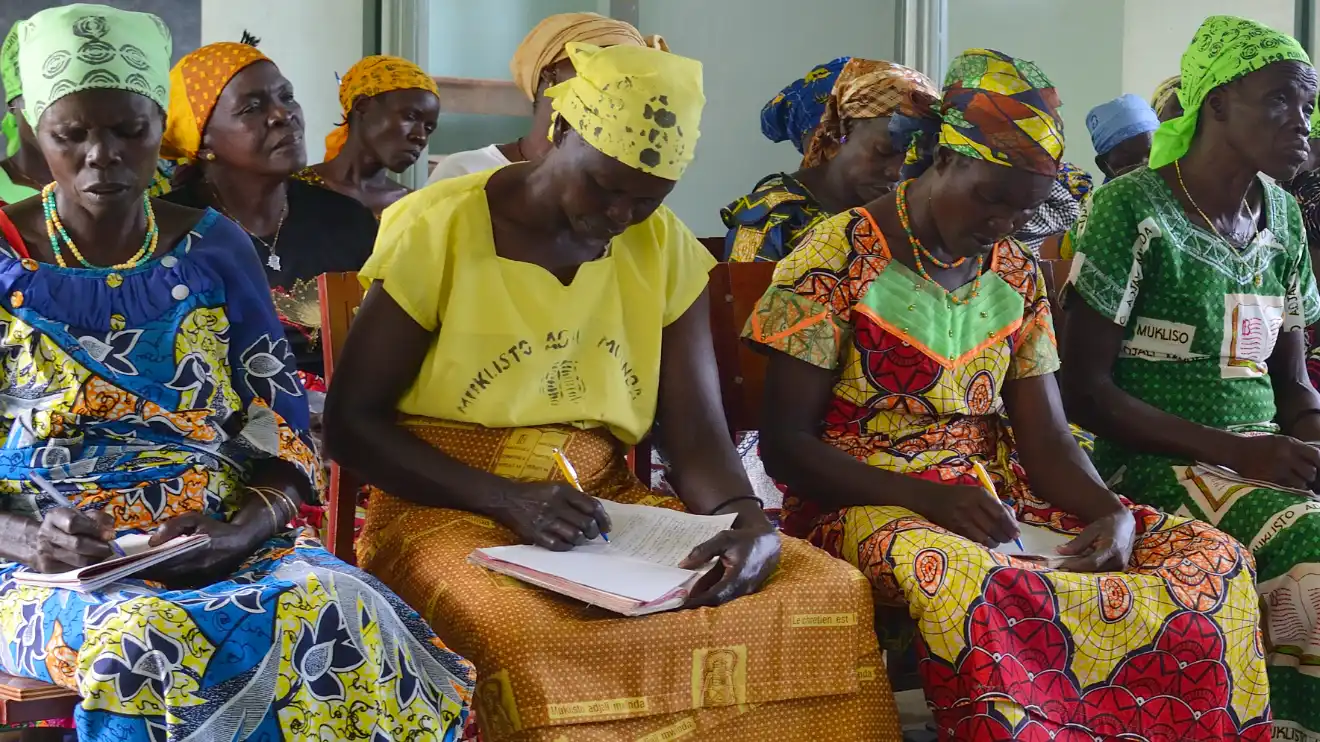
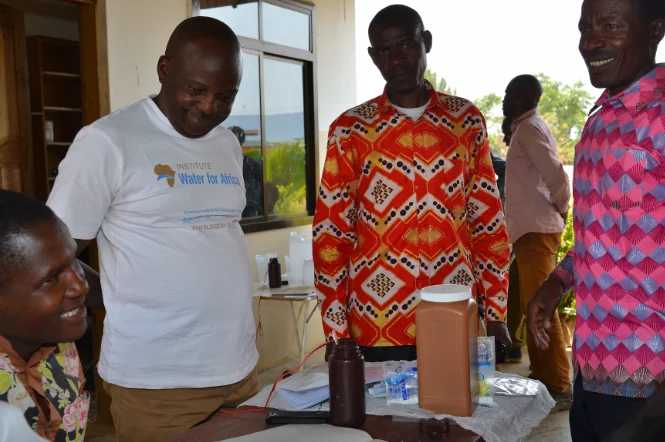
Workshops
Our seminars are mainly aimed at people who are responsible for local water projects.
Contents include the basics of water supply, WASH, etc.
A good knowledge of maths, physics and chemistry is essential.
For seminars outside Africa, please contact Dipl.-Ing. Jürgen Baisch directly.
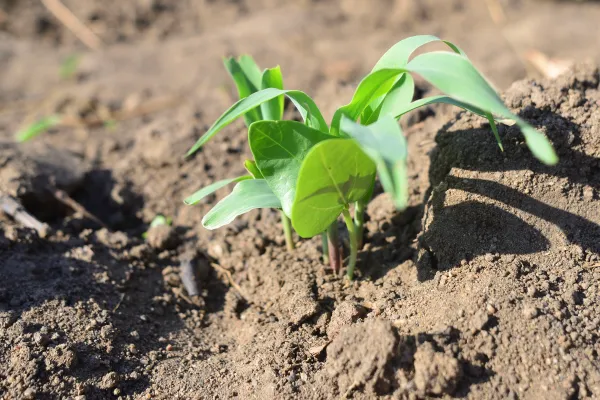
Irrigation
Irrigation makes sense wherever agriculture is not profitable or not possible due to a lack of water. This is often the case in semi-arid and arid areas.
Irrigation offers the opportunity to increase crop yields and thus become less dependent on food aid. With sufficient irrigation, soil salinisation can also be avoided. Soil that is already salinised can become salt-free again.
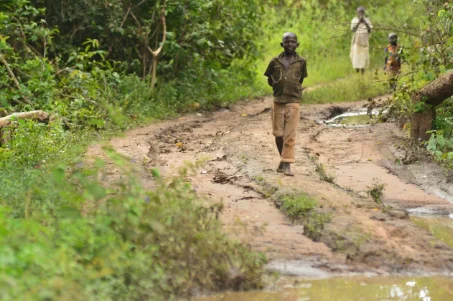
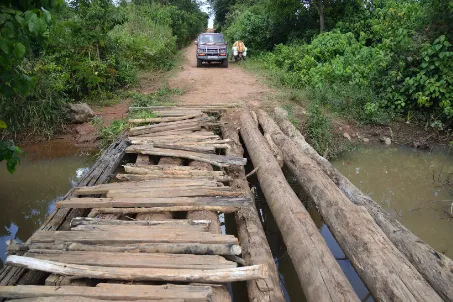
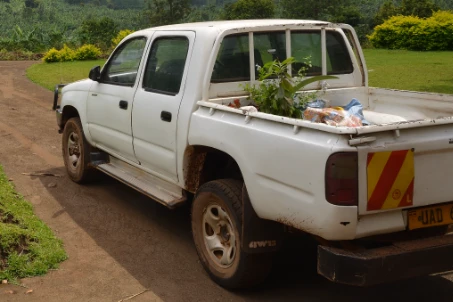
We walk miles for water ...
... even to remote places ...
where other organisations cannot help